All docs pages
View Controls & Heatmap Views
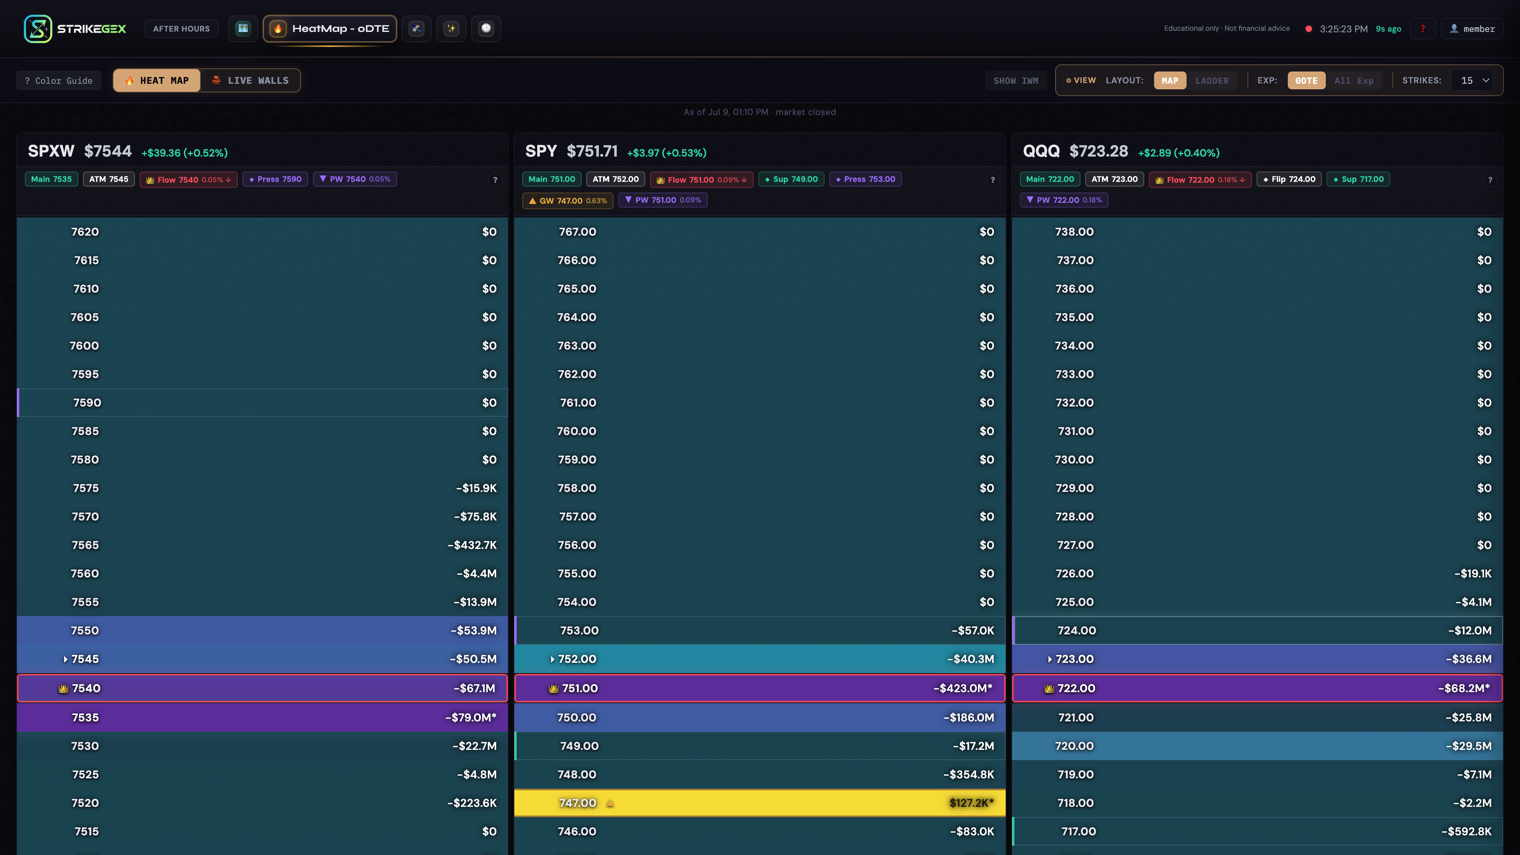
The ⚙ View group above the map is where you choose what the HeatMap shows: how it's laid out, which signal it reads from, which expirations it counts, and how many strikes fit on screen. This page walks each toggle one at a time, then explains the one that trips up most new members — Live Flow versus Dealer Positioning.
- Layout: MAP is the classic heat grid; LADDER is put/call bars with a sortable net-GEX column per strike.
- Signal: LIVE FLOW estimates dealer exposure from today’s options trades (intraday, needs a live feed); DEALER POSITIONING estimates dealer exposure from open interest (structural).
- The two views answer different questions, so they can disagree at the same strike — that's signal, not a bug.
- Exp: 0DTE vs All Exp — and this changes what the % chips mean.
- Strikes sets depth (10–60); Show IWM adds a second symbol.
Everything below describes how dealer positioning tends to shape the tape. It's educational context for your own read, not financial advice.
The controls, one at a time
| Control | What it does | When to use it |
|---|---|---|
| Layout: MAP | The classic heatmap — a colored grid of strikes. Yellow rows are positive gamma (a mean-reverting tape), purple rows are negative gamma (a momentum tape). | Default. Best for reading regime and level structure at a glance. |
| Layout: LADDER | Put and call bars per strike with a net-GEX value beside each. Click the Net GEX ⇅ header to sort by strike order or by |net| (largest magnitude first). | When you want exact per-strike balance rather than the color picture. |
| Signal: LIVE FLOW | Reads estimated dealer exposure from today’s options trades — what's being traded right now, intraday. Resets each session and needs a live options feed. | During an active session, to read the live tape. |
| Signal: DEALER POSITIONING | Estimates dealer exposure from open interest — where positioning sits, structurally. Always available. | Pre-market and off-hours, or any time you want the structural picture. |
| Exp: 0DTE | Counts only same-day expiration. | Intraday 0DTE reads. |
| Exp: All Exp | Counts all expirations together, from open interest. | Bigger structural picture across the board. |
| Strikes | How many strikes to render: 10, 15, 25, 40, or 60. Defaults to 15. | Fewer for a tight zoom around price; more to see far walls. |
| Show IWM | Adds a second symbol alongside your primary one. | When you want a companion map without leaving the tab. |
The LADDER totals: VEX, CHEX, V-FLIP
When flow data carries them, the ladder shows three totals across the top. Each is a plain sensitivity readout — no math required:
- VEX — vanna exposure. Read it as sensitivity to volatility shifts: how positioning reacts when implied volatility moves.
- CHEX — charm exposure. Read it as pin flow into the close: the drift positioning tends to create as expiration approaches.
- V-FLIP — the strike where cumulative vanna crosses zero, the vanna analog of the gamma ◆ Flip.
Green totals lean one way, red the other; as with everything on the map, treat the magnitudes as relative strength — compare them, don't read units into them.
The big one: Live Flow vs Dealer Positioning
This is the control most worth understanding. The two views are not two versions of the same number — they measure different things.
- LIVE FLOW answers what is being traded now. It's estimated dealer exposure from today’s options trades, intraday. It resets each session and needs a live session to populate.
- DEALER POSITIONING answers where positioning sits. It's estimated dealer exposure from open interest — structural, slower-moving, and available around the clock.
Because they answer different questions, the two views can legitimately point at different strikes at the same moment. Live flow might be piling into one strike while the standing open-interest structure is heaviest somewhere else. That divergence is information, not a glitch.
Before the open, Live Flow has nothing to read yet. The map shows Awaiting live flow with the note Live Flow needs live order flow, and a one-click Switch to Dealer Positioning button. Take it — Dealer Positioning is the view that has data. After the 4:15 PM ET options close, the board rolls to the next session's contracts and Live Flow shows the trades made today in those contracts.
How Exp scope changes the % chips
The % next to a strike isn't one fixed thing — its meaning depends on the Exp toggle:
- 0DTE mode: the chip is a flow shift — how the balance at that strike has moved over roughly the last 10 minutes. Read it as bulls or bears gaining control at that strike, right now. It shows only on strikes near price with meaningful recent activity.
- All Exp mode: the chip is an open-interest deviation — how far current positioning at that strike sits from the session's rolling baseline. Read it as structure building or unwinding versus where the day started.
Common questions
- Live Flow and Dealer Positioning point at different strikes. Which one is right?
- Both. Live Flow estimates dealer exposure from today’s trades; Dealer Positioning estimates exposure from open interest. They measure different things, so a split at the same strike is a real read — flow leaning one way while structure anchors another — not an error to reconcile.
- The map says "Awaiting live flow." Is something broken?
- No. LIVE FLOW needs a live session to populate, so off-hours it has nothing to show. Click Switch to Dealer Positioning to see the structural map, which is always available.
- Why does the % on a strike look different after I switch Exp?
- Because it's a different measurement. In 0DTE the % is a ~10-minute flow shift; in All Exp it's open-interest deviation from the session baseline. The number changing when you toggle is expected.
- Which layout should I start on?
- MAP for the regime-and-color read, then LADDER when you want exact per-strike net GEX and, if the signal carries them, the VEX / CHEX / V-FLIP totals.