All docs pages
History: Intraday Replay
Step back through today's session in 30-minute snapshots. History replays the same heatmap panels as they stood at each moment, so you can see how the gamma structure — the map of dealer-hedging levels — evolved into the moves you watched.
- What it is: a timeline of today's heatmap, saved every 30 minutes from 9:30 AM ET.
- How you use it: click a timestamp button to load the map exactly as it stood then.
- What to look for: where the 👑 Flow King and the walls sat versus where price actually went.
- Scope: today only. The header reads Intraday Heatmap · Today.
- Early session: before the first capture you'll see No snapshots yet for today.
- Educational only — not financial advice.
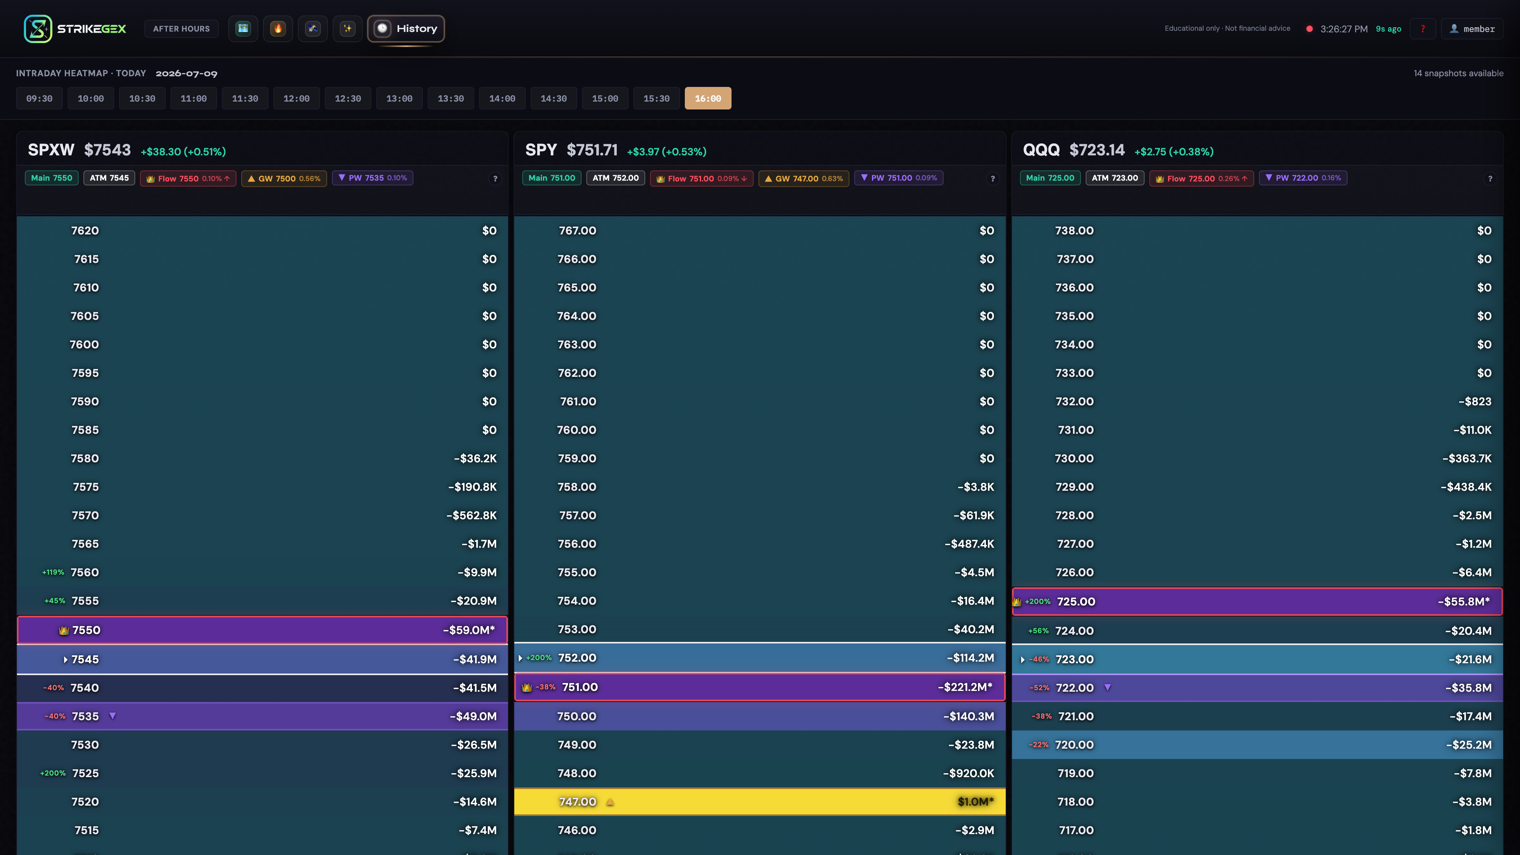
What History replays
The live Heatmap shows you where the strongest gamma levels sit right now. That view keeps moving, so once a level breaks and price runs, the picture that set up the move is gone.
History keeps that picture. Every 30 minutes from the open, StrikeGEX saves a snapshot of the heatmap. Each snapshot is the same grid of panels you already read on the live tab — the 👑 Flow King (the strongest gamma magnet near price), the Gamma Wall and Put Wall (strikes that tend to act as resistance and support), and the full column of levels around spot. You are looking at the map, frozen, as it stood at that moment.
Walkthrough
- Open the History tab. StrikeGEX loads today's captured snapshots and shows a row of timestamp buttons.
- Each button is a capture time in ET — 09:30, 10:00, 10:30, and so on. The most recent snapshot loads by default.
- Click any timestamp to load the heatmap as it stood then. The helper text reads Click a timestamp to view gamma at that moment.
- Read the loaded snapshot the same way you read the live tab: find the 👑 Flow King, note the Gamma Wall and Put Wall, and compare bar sizes — bigger bars mean stronger levels.
- Step forward through the buttons in order. Watch how the King and walls shifted, built, or faded between one capture and the next.
Ways to use it
Review a level that broke
Price sliced through a strike you expected to hold. Open History, step back to the snapshots around that time, and look at the level. Was it already thinning out before the break, or did it look solid right up to the moment price went through it? Seeing the structure that preceded the move is how you calibrate what "strong" actually looked like on that day.
See whether a wall was building or decaying
Compare the same strike across consecutive timestamps. A wall that grows from one capture to the next was strengthening into the move; one that shrinks was decaying. That building-versus-fading read is the core skill History trains — and it pairs directly with the live Wall Panels, which show wall strength changing in near-real time during the session.
Empty and loading states
What you see depends on how far into the session you are:
- Before the first capture — early in the day, no snapshot exists yet. History shows No snapshots yet for today. with the note Snapshots are captured every 30 minutes from 9:30 AM ET. Check back after the first 30-minute mark.
- While a snapshot loads — you'll briefly see a loading state before the panels render.
- Once captures exist — the timestamp row fills in and the latest snapshot loads automatically.
Common questions
- Can I look at yesterday, or last week?
- No. History is today-only — the header says Intraday Heatmap · Today and the snapshots reset each session. It's a same-day replay tool, not an archive.
- Why are there only a couple of timestamps this morning?
- Captures happen every 30 minutes starting at 9:30 AM ET, so the number of buttons grows through the day. A short row early on is normal; it fills in as the session runs.
- Is a History snapshot the same as the live Heatmap?
- Yes — it's the same panels and the same levels (👑 Flow King, walls, the column around spot), just frozen at a past moment instead of updating live.
- What's the difference between History and Wall Panels?
- Wall Panels track wall strength live during the session. History replays the whole heatmap after the fact at 30-minute steps. Use Wall Panels in the moment; use History to review.