All docs pages
StrikeMap: The 300-Symbol Scanner
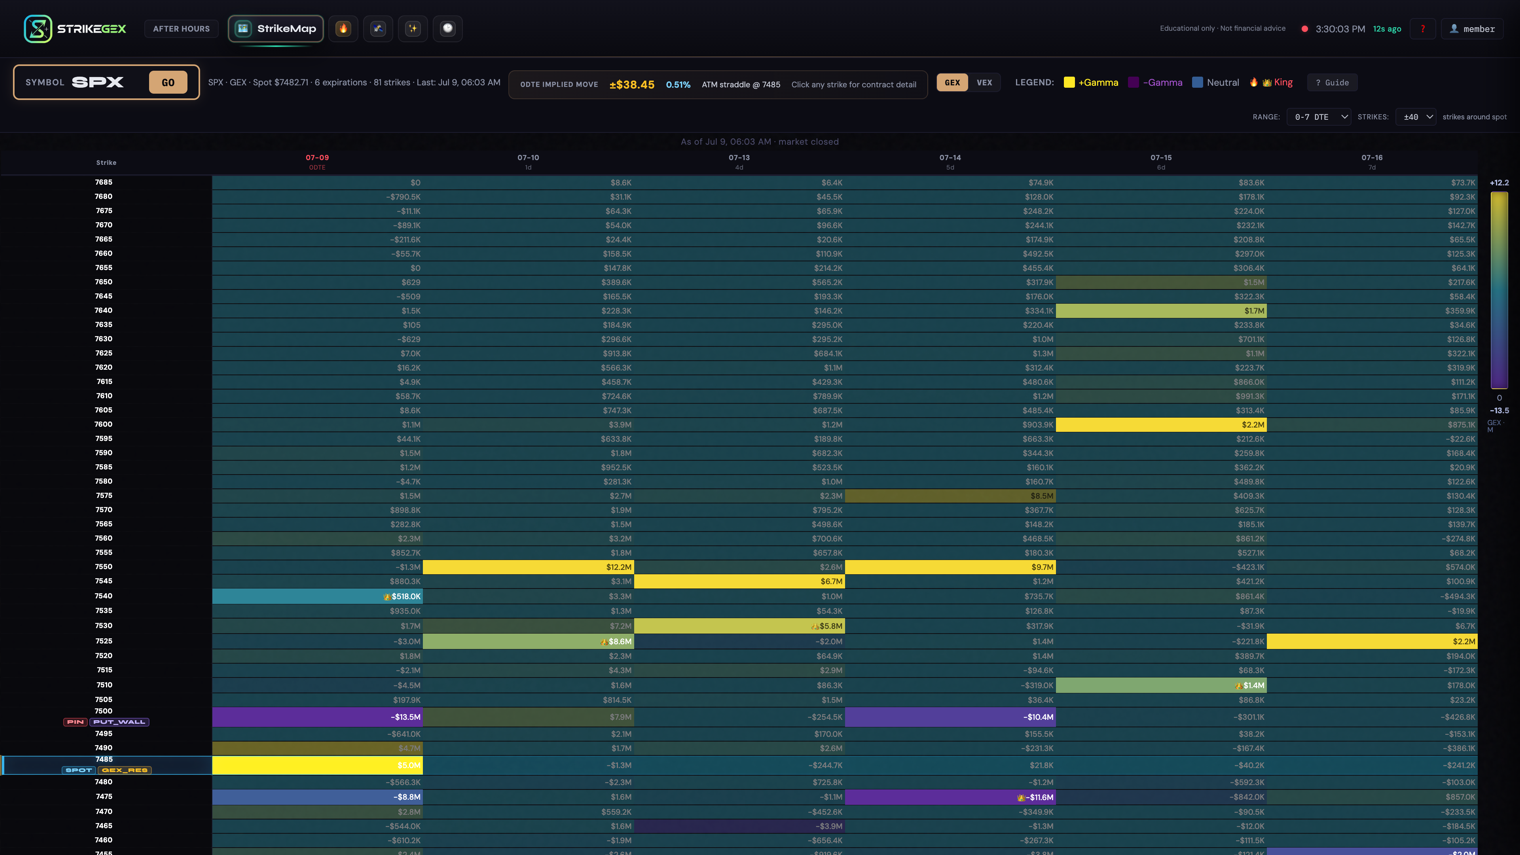
StrikeMap is the strikes × expirations matrix for 300+ tickers. Instead of staring at one index, you search any name and read its gamma structure — where dealer positioning concentrates, strike by strike, expiry by expiry — in a single grid. It's a Pro feature.
- Open the 🗺️ StrikeMap tab, type a symbol, press GO.
- Rows are strikes; columns are expirations. A 👑 marks the strongest strike in each column.
- Brighter cells = heavier relative concentration for that column. Dim cells are the quiet background.
- Toggle GEX (price sensitivity) vs VEX (volatility sensitivity), and set the Range and Strikes shown.
- A 0DTE Implied Move banner shows the expected same-day move for the symbol you're viewing.
- Coverage: core index symbols refresh every 60 seconds; the wider universe refreshes hourly.
Everything below is educational context for reading structure, not financial advice. StrikeMap shows you where positioning sits; what you do with that is your call.
Walk through a symbol
- Open the 🗺️ StrikeMap tab. If you see a 🔒 on the tab, StrikeMap is Pro-only on your plan — see Common questions below.
- Click the Symbol box and start typing. An autocomplete list appears; use the arrow keys and Enter, or click a ticker.
- Press GO (or Enter). The grid loads for that symbol.
- Read the grid: each row is a strike, each column is an expiration. The 0DTE column header is tinted red and reads 0DTE; other columns show their date and days-to-expiry.
- Find the 👑 crowns. One sits in each column, on that column's strongest strike — the level most worth watching for that expiry.
- Read the color. For each column, brighter cells carry the heaviest relative concentration; mid and low cells fade toward the neutral tone so only the genuine walls stand out. Yellow leans positive gamma (a mean-reverting tape), purple leans negative gamma (a momentum tape).
The 0DTE Implied Move banner
Above the grid, the 0DTE Implied Move banner shows the market's expected same-day range for the symbol you're viewing — an ±$ figure and a percent, drawn from the at-the-money straddle (labeled ATM straddle @ <strike>). It's the quick answer to "how far is this name expected to travel today?" Click any strike row for its contract detail.
Controls
| Control | What it does | When to use it |
|---|---|---|
| Symbol + GO | Search any covered ticker with autocomplete, then load its matrix. | Every time you switch names. |
| GEX | Gamma exposure — sensitivity to price changes. The default metric. | Reading walls, magnets, and the gamma regime. |
| VEX | Vanna exposure — sensitivity to volatility changes. Swaps the grid to the volatility lens; the legend relabels to +VEX / −VEX. | When you care how positioning reacts to a shift in implied volatility, not just price. |
| Range | Which expirations the grid includes: 0-45 DTE, 0-7 DTE (default), or 0-21 DTE. | Tighter for the near-term picture; wider to see structure building out in time. |
| Strikes | How many strikes to show around spot: ±8, ±20, ±40 (default), ±60, or All. | Fewer for a tight zoom around price; All to see far walls. |
| ? Guide | Opens the color guide — the same legend key used across the app. | Any time a color or crown isn't obvious. |
Coverage & freshness
StrikeMap spans the index complex, mega-cap names, and sector ETFs — 300+ tickers. Core 0DTE index symbols refresh every 60 seconds during market hours; the full universe across all symbols refreshes hourly. The symbol info line beneath the search box confirms what you're looking at — symbol, metric, spot, expirations, strikes — and when data is delayed or the market is closed, a banner above the grid states the last-update time so you're never reading stale numbers as live ones.
Common questions
- The StrikeMap tab shows a 🔒. How do I get in?
- StrikeMap is a Pro feature. Opening it on a lower tier shows the StrikeMap — Pro Only upgrade panel with the Pro plan at $249/mo and Annual at $1,990/yr. Upgrade and the tab unlocks. See Plans & Billing.
- I searched a ticker and it's not there. Can I add it?
- Yes. Type the ticker; if we don't cover it yet, the dropdown shows No StrikeMap for <TICKER> yet. with a + Request <TICKER> button. Click it and you'll get a confirmation that the symbol will be live within 48 hours. Coverage also adjusts automatically over time to keep data quality high, so an occasional gap is expected.
- Why does one column look brighter than the one next to it?
- Each column is scaled to its own peak so its structure is readable, and cells below a column's top few dim to the background. So brightness tells you where a strike ranks within that expiration, not across expirations. Read down a column, then compare crowns across columns.
- What's the difference between GEX and VEX here?
- GEX is gamma exposure — sensitivity to price changes, the default read for walls and regime. VEX is vanna exposure — sensitivity to volatility changes. Same grid, same strikes and columns; VEX just asks a different question of the positioning.