All docs pages
Welcome to StrikeGEX
StrikeGEX turns dealer-gamma levels (the strikes where options market makers are pinned) and live options flow into readable intraday structure — the walls, magnets, and pockets that shape how an index moves during the session. This page is the map: what StrikeGEX is, what each tab does, and where to start.
- Built for 0DTE and intraday index traders (SPX, SPY, QQQ, IWM). No prior gamma-exposure fluency assumed — every term is glossed the first time it appears.
- The core read is one screen: where price is likely to bounce, stall, or run, updated every 60 seconds during market hours.
- Five member surfaces, one shared idea: the same live gamma structure, shown from different angles.
- Public daily pages (/levels, /recaps) are free and shareable; the tabs below are for signed-in members.
- Start by activating your account, then run your first session.
What StrikeGEX is
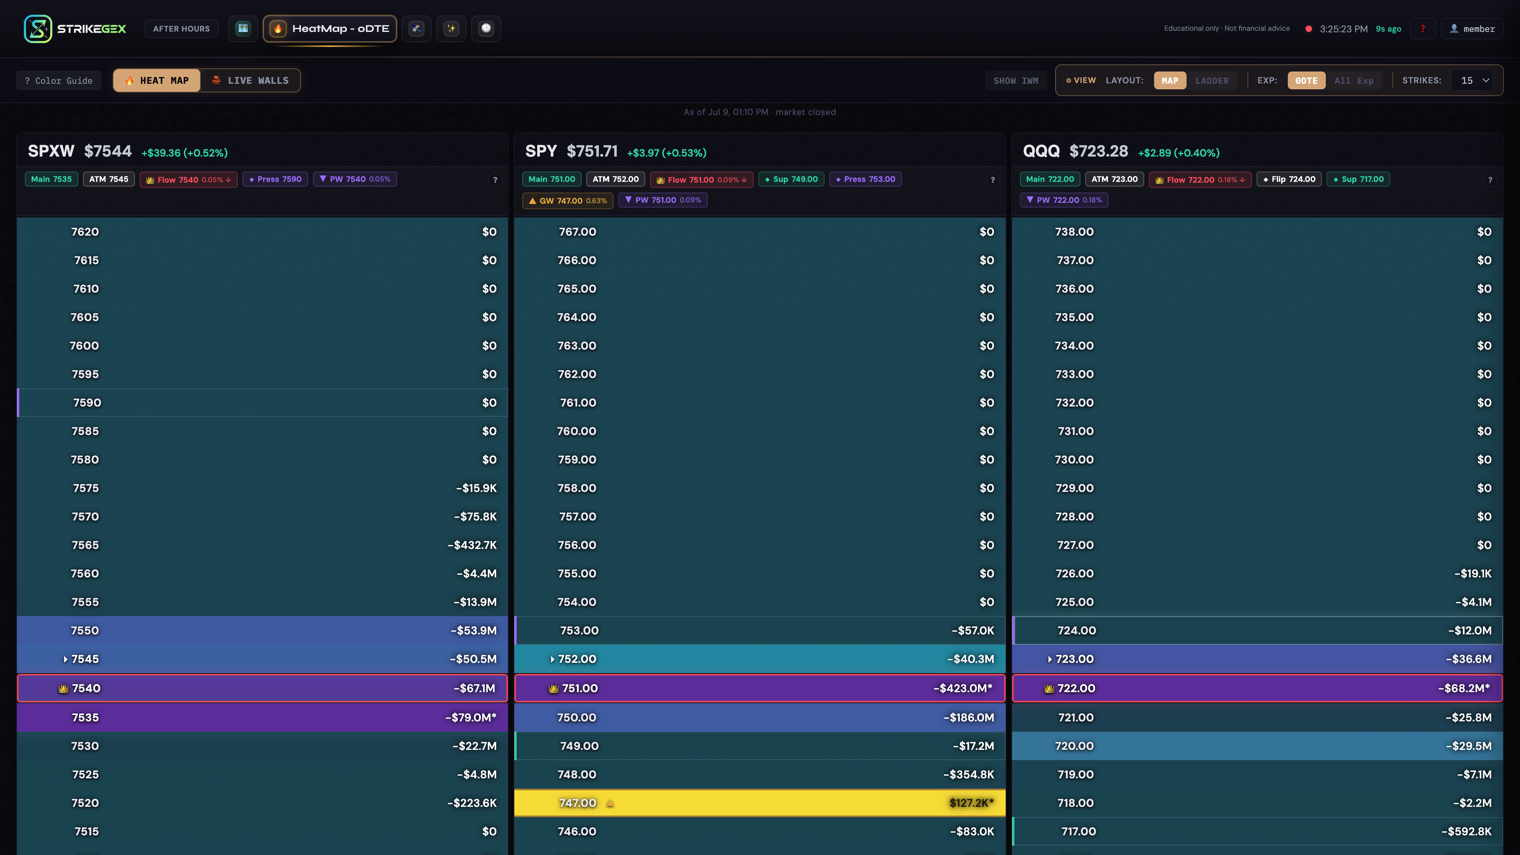
Options market makers hedge their books at specific strikes. Those strikes stop behaving like ordinary prices — they start acting like gamma walls (levels price tends to bounce off), magnets (levels price drifts toward), and thin zones price accelerates through. StrikeGEX reads your live options feed and paints that structure so you can see it at a glance instead of inferring it.
The tape has two broad moods, and the color of a level tells you which one you are in. Yellow marks positive gamma — a mean-reverting tape where failed breaks tend to snap back toward nearby levels. Purple marks negative gamma — a momentum tape where breaks extend and pushes run further. That single distinction reframes every level on the screen. The ? Color Guide button inside the app explains the palette in full.
Who it is for
If you trade index options on the day, StrikeGEX is built for your session. You do not need to already understand gamma exposure — the app leads with plain-English readouts and the docs teach the vocabulary as you go. If you want the underlying theory rather than the how-to, /learn has the full library.
The member surfaces
Every tab draws from the same live gamma structure. Pick the one that matches the question you are asking.
| Tab | What it shows | Reach for it when |
|---|---|---|
| HeatMap - 0DTE SPX · SPY · QQQ · IWM | Per-strike gamma for the core index symbols — the wall-and-magnet map, row by row. A HEAT MAP · LIVE WALLS switcher flips the same symbols into side-by-side 0DTE wall ladders. | You want to see every level for one symbol and where the strong ones sit relative to price, or line the core symbols up together to compare them. |
| StrikeChart GEX Nodes | The gamma levels painted directly onto price candles, so structure and price action share one view. | You think in candles and want the levels living on the chart, not beside it. |
| StrikeMap Live Matrix | A scanner across 300+ symbols — the wide-angle lens for spotting where structure is building. | You want to sweep beyond the core index names and find the day's notable setups. |
| History GEX Archive | An intraday replay: 30-minute heatmap snapshots you can step through to see how structure moved. | You want to review how the day built, or study a move after the fact. |
| Commander Flow Alignment | The single-verdict console: who is in control, with what conviction, and where the risk of a turn sits. Open it at /commander. | You want the whole read in one glance instead of assembling it panel by panel. |
The public daily pages
Two surfaces live outside the member app and need no sign-in. /levels publishes the day's key gamma levels for the core symbols — shareable, and a fair preview of what the tabs go deeper on. /recaps is the session recap archive: how the levels actually held up after the close. Both are free.
How these docs are organized
The docs follow the order you'll actually use the product. Getting Started gets you signed in and through a first session. From there, one page per tab explains its controls and reads in depth, and a data-freshness page covers when the numbers update. Wherever a page discusses interpreting a level, it points you to a /learn article for the theory behind it — the docs teach the how, /learn teaches the why.
Where to go first
Two steps and you're trading with the levels in front of you:
- Activate your account and sign in — get access to the member tabs.
- Run your first session — open the HeatMap, read the color and the walls, and orient yourself before the tape moves.
Common questions
- Do I need to understand gamma exposure before I start?
- No. The app leads with plain-English readouts — colors, walls, and a single verdict — and the docs gloss each term the first time it appears. Pick up the theory from /learn at your own pace.
- Which tab should I actually watch during the session?
- Most members anchor on the HeatMap - 0DTE for a single symbol, or StrikeChart when they want the levels living on the price candles. The other tabs are the same structure from a different angle — use whichever matches the question you're asking.
- How current is the data?
- The core 0DTE symbols refresh every 60 seconds during market hours. The History tab stores 30-minute snapshots so you can replay the session. The data-freshness page covers the full cadence.
- Is StrikeGEX telling me what to trade?
- No. It shows structure and context so you can make your own call. It's an educational tool — not financial advice.